 Avalok
See what your coding agent did to your architecture.
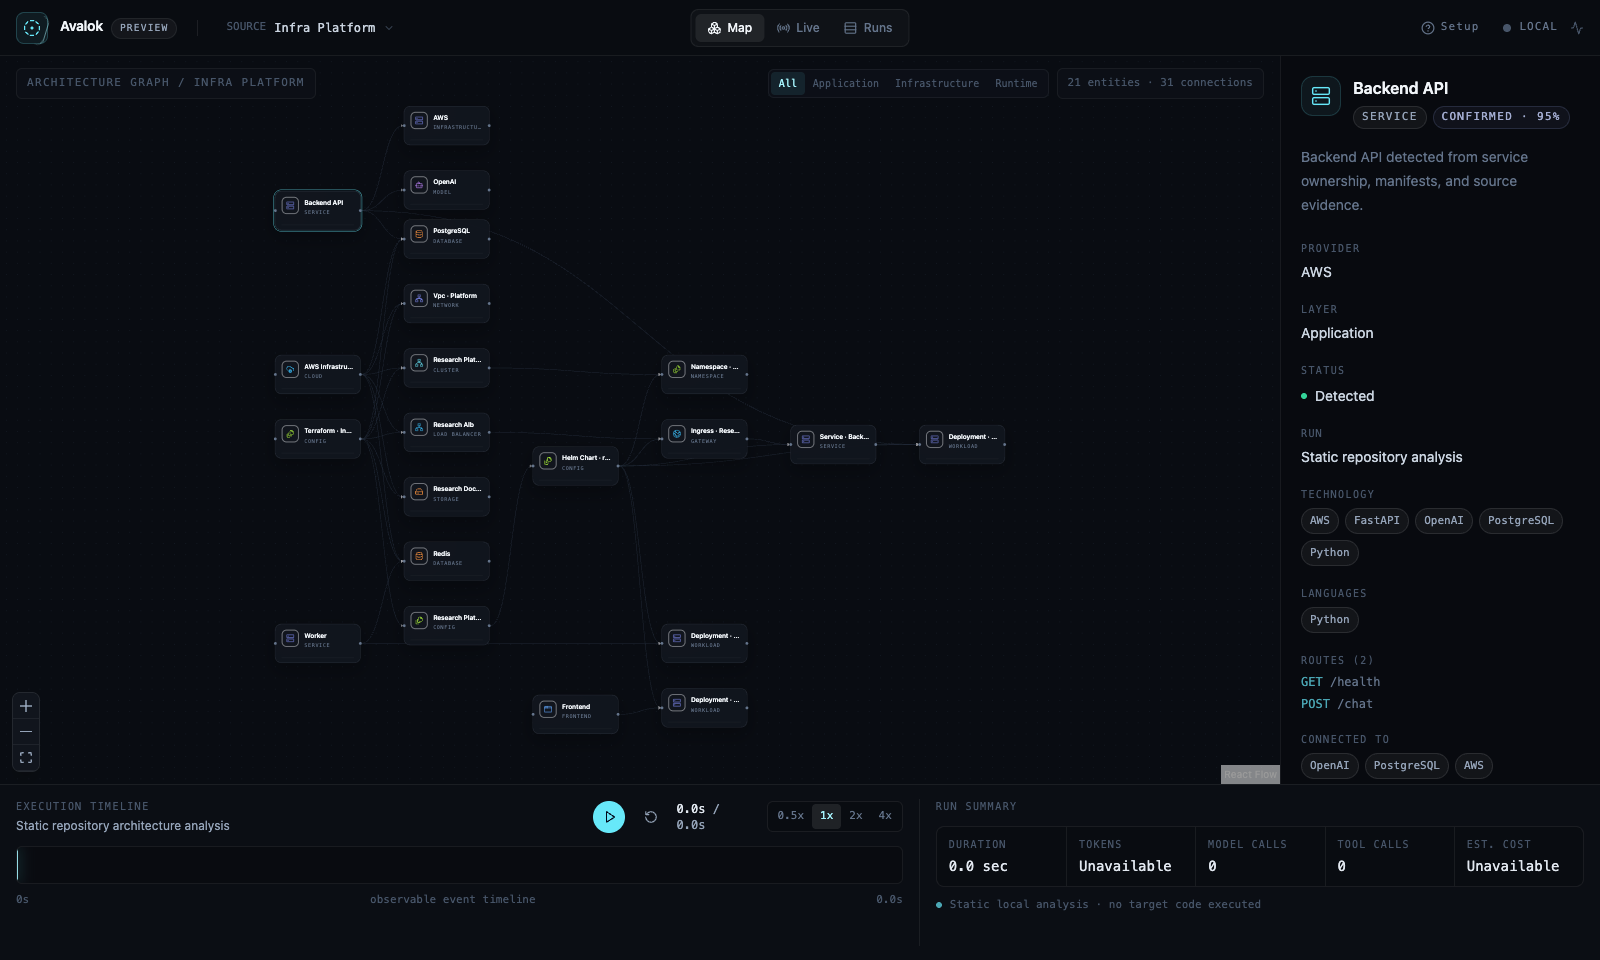
Avalok maps your repository, overlays what Claude Code or Codex actually did, and turns the session into a recap you can share. One command. No account. Nothing leaves your machine.
Requires Node.js 22.12+ · macOS, Linux and Windows
Reads what you already have
How it works
Run it once. See the whole session.
The loop is three steps, and none of them need a login.
Map the repository
Avalok reads your source and configuration and draws services, datastores and deployment on one canvas. It never runs, builds or installs anything from your repo.
See where the agent went
Run it while Claude Code or Codex works, or after. The map lights up with the files touched, commands run, time spent and what failed.
Share the recap
One click, or avalok recap, gives you a card, an interactive replay, a diagram or a Markdown block for your pull request. You preview it first.
What you get
An honest map, with evidence.
Avalok says detected, observed and inferred, and shows why. It does not pretend to understand more than it does.
Architecture, detected
Services, routes, model and datastore integrations from TypeScript and Python. Every element shows its evidence and a confidence level.
Infrastructure in context
Terraform, Kubernetes, Helm, Docker and Compose are parsed as data, then linked to the services they deploy. Configured, not live state.
Agent replay
Codex and Claude Code sessions are read from disk, read-only, with no setup. Scrub a timeline of what happened.
OpenTelemetry native
Point any OTLP/HTTP trace exporter at the local receiver. No Collector needed. OpenInference spans show up as agent activity.
Recaps for your PR
A card, an HTML replay anyone can open, an architecture diagram for your README, and Markdown. Prompts, commands and file paths are never included.
Local-first, provably
The tool has no account, analytics or cloud. Both servers bind to 127.0.0.1. You can verify that yourself in one command.
Privacy
Don't take our word for it.
The dashboard and receiver bind to 127.0.0.1 only. Run this and look at the addresses yourself.
Full privacy detailsavalok demo --no-open &
lsof -nP -iTCP -sTCP:LISTEN | grep -E ":(4737|4318)"
# both lines show 127.0.0.1,
# not * or 0.0.0.0Questions
Straight answers.
Does anything leave my machine?+
No. The Avalok tool has no cloud service, account, analytics, crash reporting or update check. It analyses your repository without executing it, uploading source or calling an LLM.
Which agents does it support?+
Codex and Claude Code, both through their own local session files with no setup (read-only). Kiro and Cursor are on the roadmap. Any OTLP/HTTP trace source works too.
What does it need?+
Node.js 22.12 or newer. Then run npx avalok in a repository.
Is it free?+
Yes. The code is Apache-2.0. A hosted or team tier may exist someday as a separate product and would not change what the local edition does.
Does it understand my whole system?+
No, and it does not claim to. It reports what it detected, observed or inferred, with evidence. Deep analysis covers TypeScript and Python; other languages are inventoried.
Try it on your next agent session.
It's a developer preview. Tell us what breaks and what you wanted it to show.